The CineGraph Technology Demo
Eight scenes, two minutes, no dataset to defend — what the engine itself can put on screen.
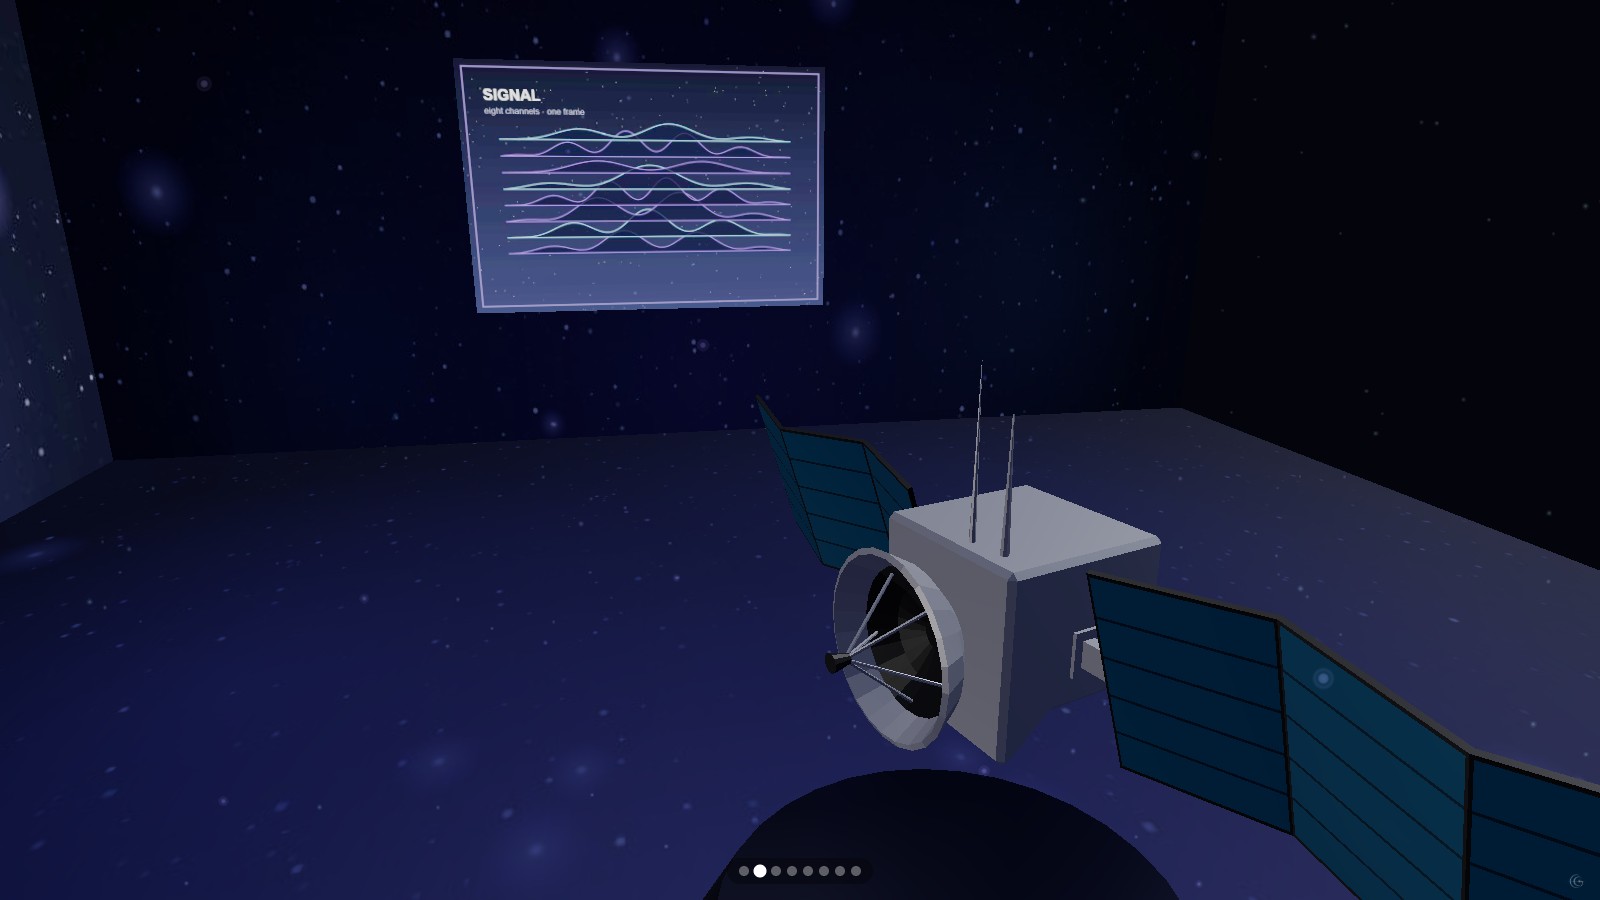
Every other entry in this gallery is a story about something. This one is a story about the tool: a 137-second reel that walks through the renderer scene by scene, from a lit room with a 3D model and a playing video to a globe, a terrain heatmap and eight chart families arriving in twenty seconds.
It opens on a title and a single bar chart standing in open space, then moves into a room — walls, floor, a travelling spotlight, an imported glTF model and a video playing on a surface inside the scene. That second scene is the one that answers the question people usually ask first: is this really 3D, or a video of something 3D. The camera orbits and the shadows move with it.
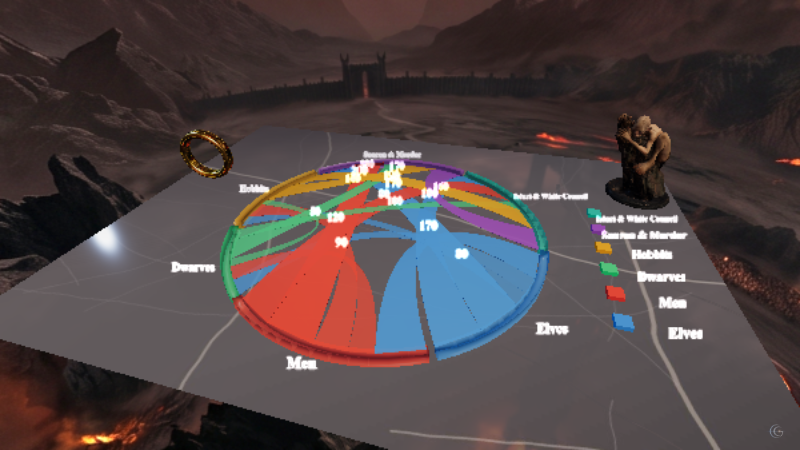
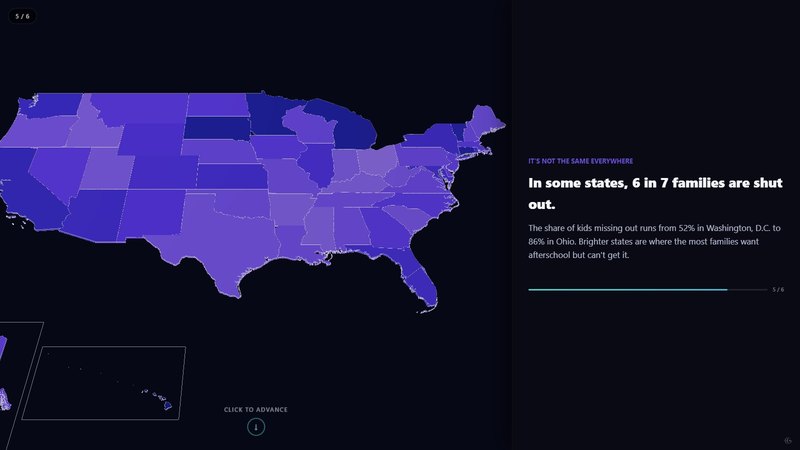
The middle is deliberately fast. "Rapid Fire" brings in eight chart families — bar, pie, radial histogram, scatter, treemap, sunburst, radar and chord — one after another in about twenty seconds, all sharing one palette and one set of type rules. Then the pace slows again for three scenes that each hold a single idea: a node-link diagram of how a scene gets made, a globe with intercontinental arcs, and a heatmap where density is rendered as elevation rather than colour alone.
The last two scenes come back down to the primitives — crystals, torus, diamond, spiral entering and leaving the frame on keyframes — and then close on an invitation. There is a soundtrack, and both the model and the video are embedded in the presentation rather than streamed from anywhere, so the whole thing is self-contained.
The numbers in it are illustrative, not sourced: this is a capability reel, and the charts are there to show the renderer rather than to make a claim about the world. If you want to see what the engine does before deciding whether your own data belongs in it, this is the shortest route.
What this one demonstrates
- Lit interior set with a travelling spotlight
- Embedded glTF model and in-scene video playback
- Eight chart families under one visual language
- Elevation heatmap and 3D globe with arcs
- Primitive enter/exit keyframe choreography
- Scene soundtrack and timed camera moves
- Chart types
- 3D bar chart, Pie chart, Radial histogram, Scatter plot, Treemap, Sunburst, Radar chart, Chord diagram, Network diagram, 3D globe map, Elevation heatmap
- Format
- Timeline · 8 scenes
- Topic
- Technology