The Lord of the Rings, as a Network
Six factions of Middle-earth and how tightly their stories are woven together, staged in front of the Black Gate with the One Ring itself.
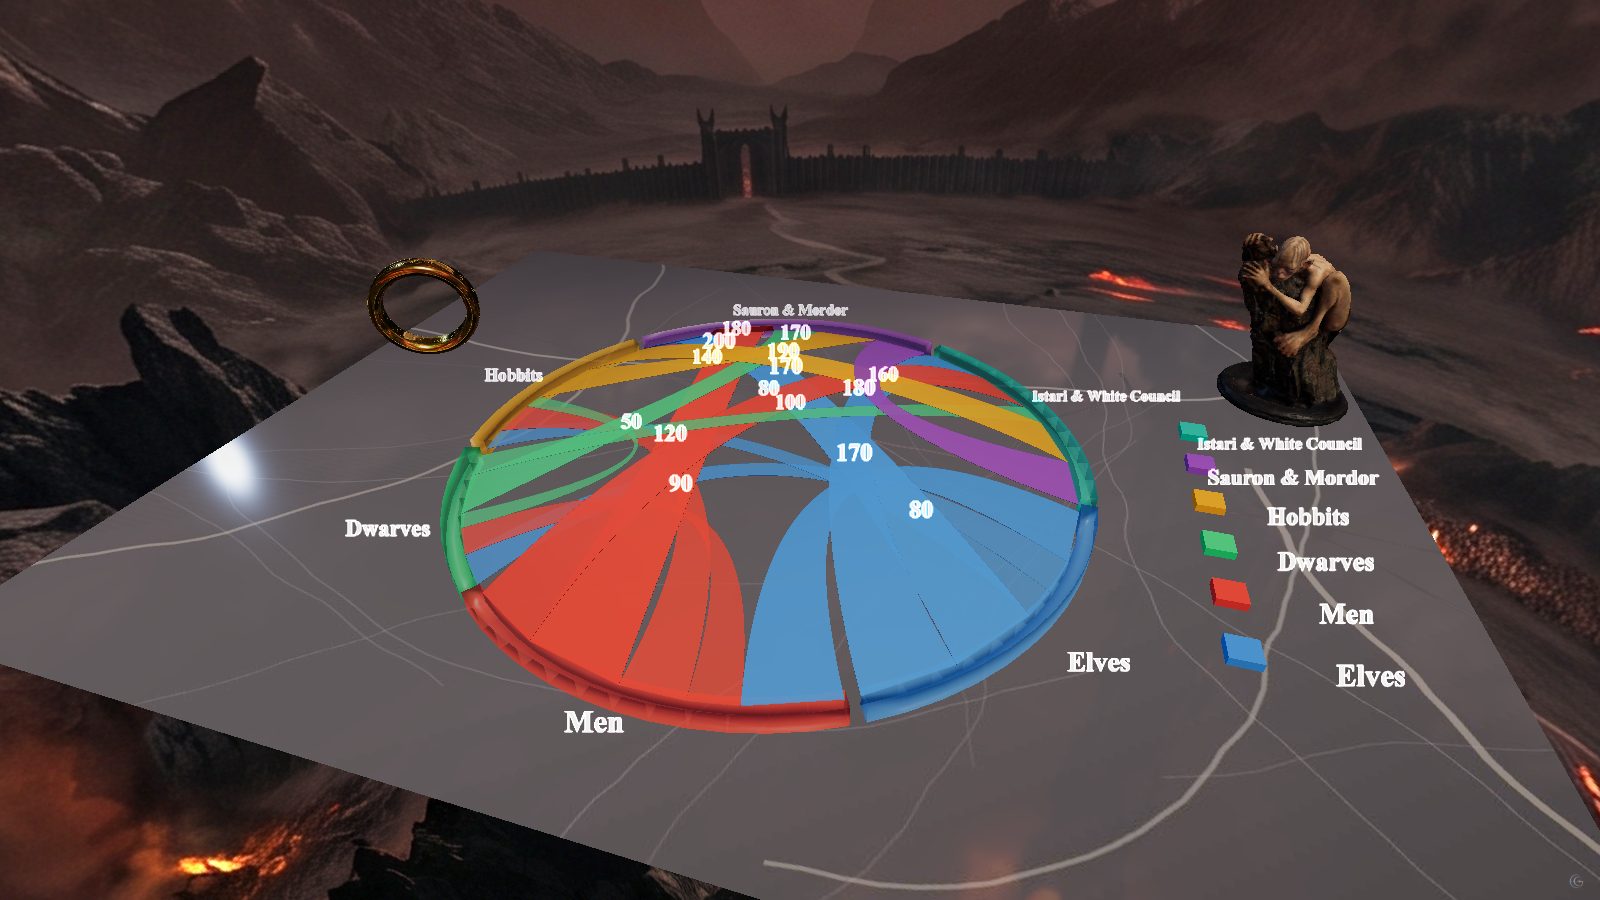
Elves, Men, Dwarves, Hobbits, Sauron and Mordor, and the Istari and White Council — six factions whose plotlines run through each other constantly across the books. A chord diagram draws every pairing as a ribbon, sized by how entangled the two sides are, and a modelled Ring sits in the scene next to them.
Every ribbon in the wheel is one relationship: Frodo and Sam carrying the Ring through Mordor, Aragorn rallying the Rohirrim, Gandalf pulling the White Council together against Sauron. Ribbon width stands in for how much of the narrative that pairing carries — Men and Sauron & Mordor draw the widest band in the wheel, which tracks with how much of the trilogy is a war between those two sides.
The scene is not just the chart. A modelled Ring sits to one side, gold and slightly worn, and the frame is staged against the Black Gate of Mordor under a red sky — the same imagery the story itself uses to mean "the war has started." The chart and the set are telling the same story from two directions.
This one started as a Reddit post rather than a dataset: a fan project mapping character and faction relationships across the legendarium, rebuilt here as a single 3D scene instead of a flat diagram. It is a good example of what the chord chart type is for — six categories is about where a 2D chord diagram starts getting hard to read, and depth plus color keeps the crossing ribbons legible.
What this one demonstrates
- Chord diagram with a modelled 3D object in the same shot
- Equirectangular background set to match the story
- Legend and ribbon labels moved by hand for readability
- Fan data rebuilt as a single, single-scene composition
- Chart types
- Chord diagram, 3D model
- Format
- Timeline · 1 scene
- Topic
- Culture
- Data source
- Fan-compiled character and faction relationships from The Lord of the Rings