Cooling a Hotter World
A scrollytelling retelling of the IEA’s 2026 cooling-demand commentary — shipments, ownership, degree-days and the 2035 outlook, each on its own scene.
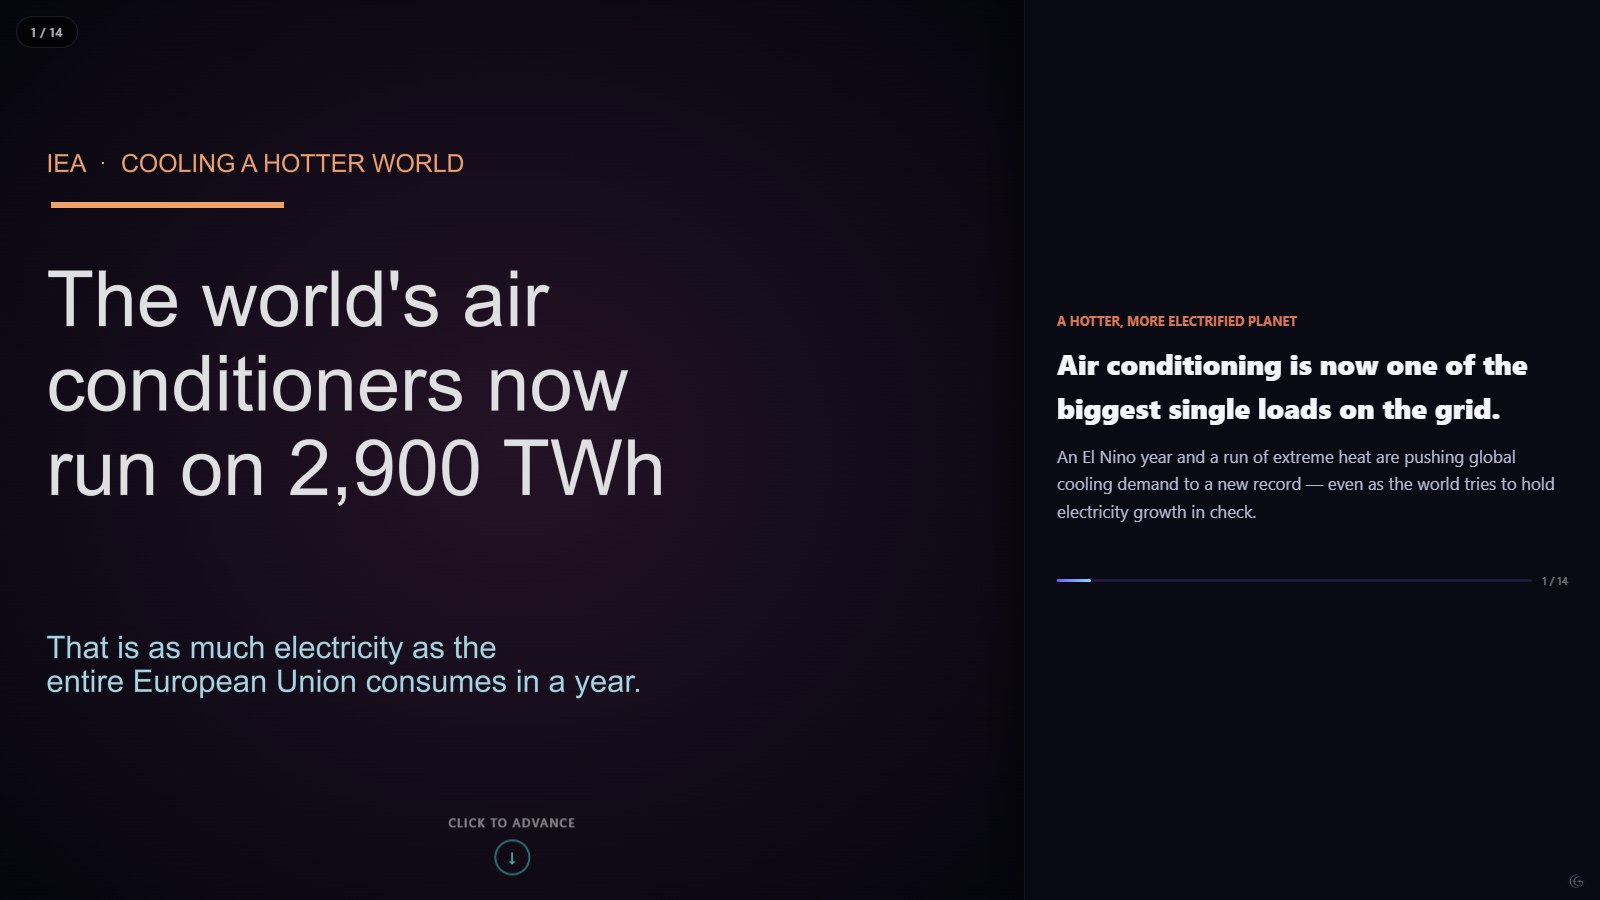
Air conditioning now draws roughly 2,900 TWh a year — more than the European Union’s entire electricity demand — and El Niño-driven heat is pushing it higher still. This deck rebuilds the IEA’s July 2026 commentary "Cooling a hotter world" as a fourteen-step scroll story, pairing every claim with the chart type that argument actually needs.
The source article leans on one habit worth borrowing: a different chart for a different question. Regional air conditioner shipments get a multi-series line (China alone shipped over 106 million units in 2025, more than ten times the United States); the widening gap between 2020 and 2024 cooling degree-days becomes a grouped bar, China/Europe against Japan/Korea; the split between annual and peak electricity share — 10% of the year, 30% of the worst day — is a plain two-bar comparison rather than a pie chart pretending to be precise.
Every number charted is one the IEA states outright: the 1,600 TWh of added demand by 2035 under current policy, the extra 700 TWh a more El Niño-prone world could add on top, the four-times gap between the most and least efficient air conditioners sold today. Where the source only gives a qualitative claim — Southeast Asia and India trailing "well below" the global ownership average, without a number — the deck says so in prose instead of inventing a bar to fill the gap.
The regional shipment figures (China, India, the United States, Japan, 2020–2025) were read directly off the IEA’s own interactive chart, point by point, rather than estimated — the other six regions in that chart overlap as slivers too thin to read reliably and are left out rather than guessed at.
What this one demonstrates
- Multi-series line chart for a genuine six-year time series
- Grouped bar chart for a two-point before/after comparison
- Radar chart used for a three-tier efficiency spread
- Per-scene background gradients instead of one repeated void
- Reading exact figures off a live third-party chart via tooltip hover, point by point
- Chart types
- Line chart, Grouped bar chart, Bar chart, Radar chart
- Format
- Scrollytelling · 10 scenes
- Topic
- Energy
- Data source
- International Energy Agency (IEA), "Cooling a hotter world" commentary, July 2026