The Price of a Squad
Nine national squads, every player a rectangle, sized by market value — a treemap of who is carrying whom.
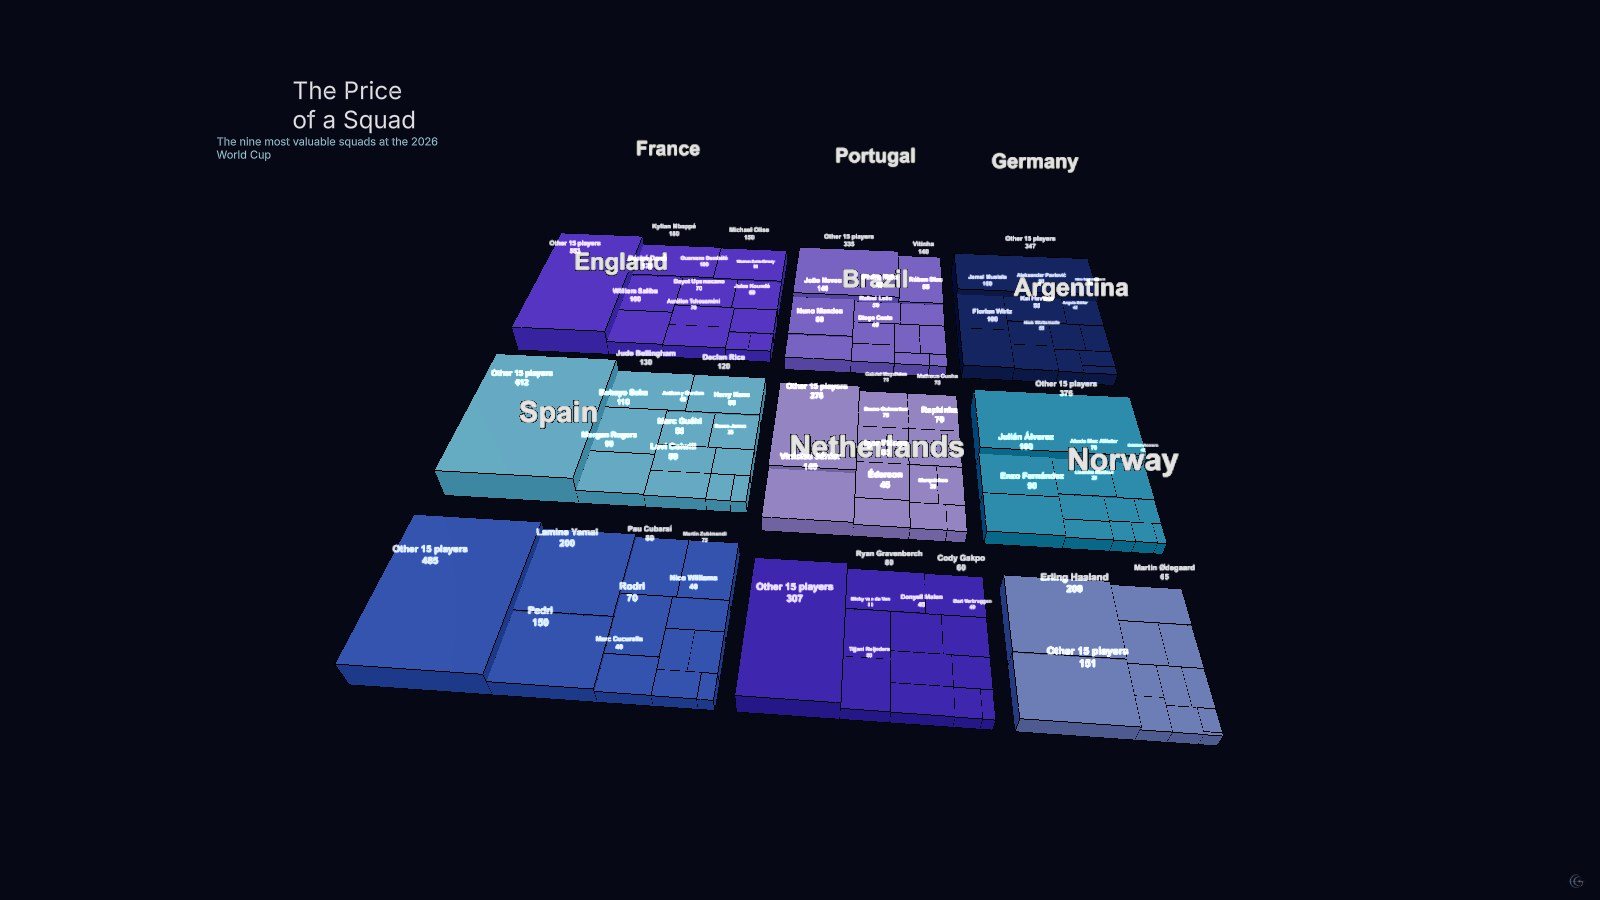
The nine most valuable squads at the 2026 World Cup, broken down player by player. Each country is a block, each player a rectangle inside it, and the area is market value in euros.
A treemap answers two questions at once, which is why it suits this data. The outer blocks say which squads are worth the most; the inner rectangles say whether that value sits in two or three names or is spread across the roster. France and England look similar from the outside and are built very differently on the inside.
Norway is the clearest single-player case in the set: one rectangle takes a share of the block that no other squad has. Each country also carries an "other 15 players" rectangle so the totals stay honest rather than only showing the named stars.
The blocks are extruded, which is mostly a legibility trick — depth separates adjacent rectangles of similar colour better than a border does at this density.
What this one demonstrates
- Hierarchical treemap, two levels deep
- Extrusion as a separation cue
- Residual "other players" bucket for honest totals
- Label sizing driven by rectangle area
- Chart types
- Treemap
- Format
- Timeline · 1 scene
- Topic
- Sport