Where the World Is Building New Power
Every power plant currently under construction — 1.64 terawatts of it — by country and by technology.
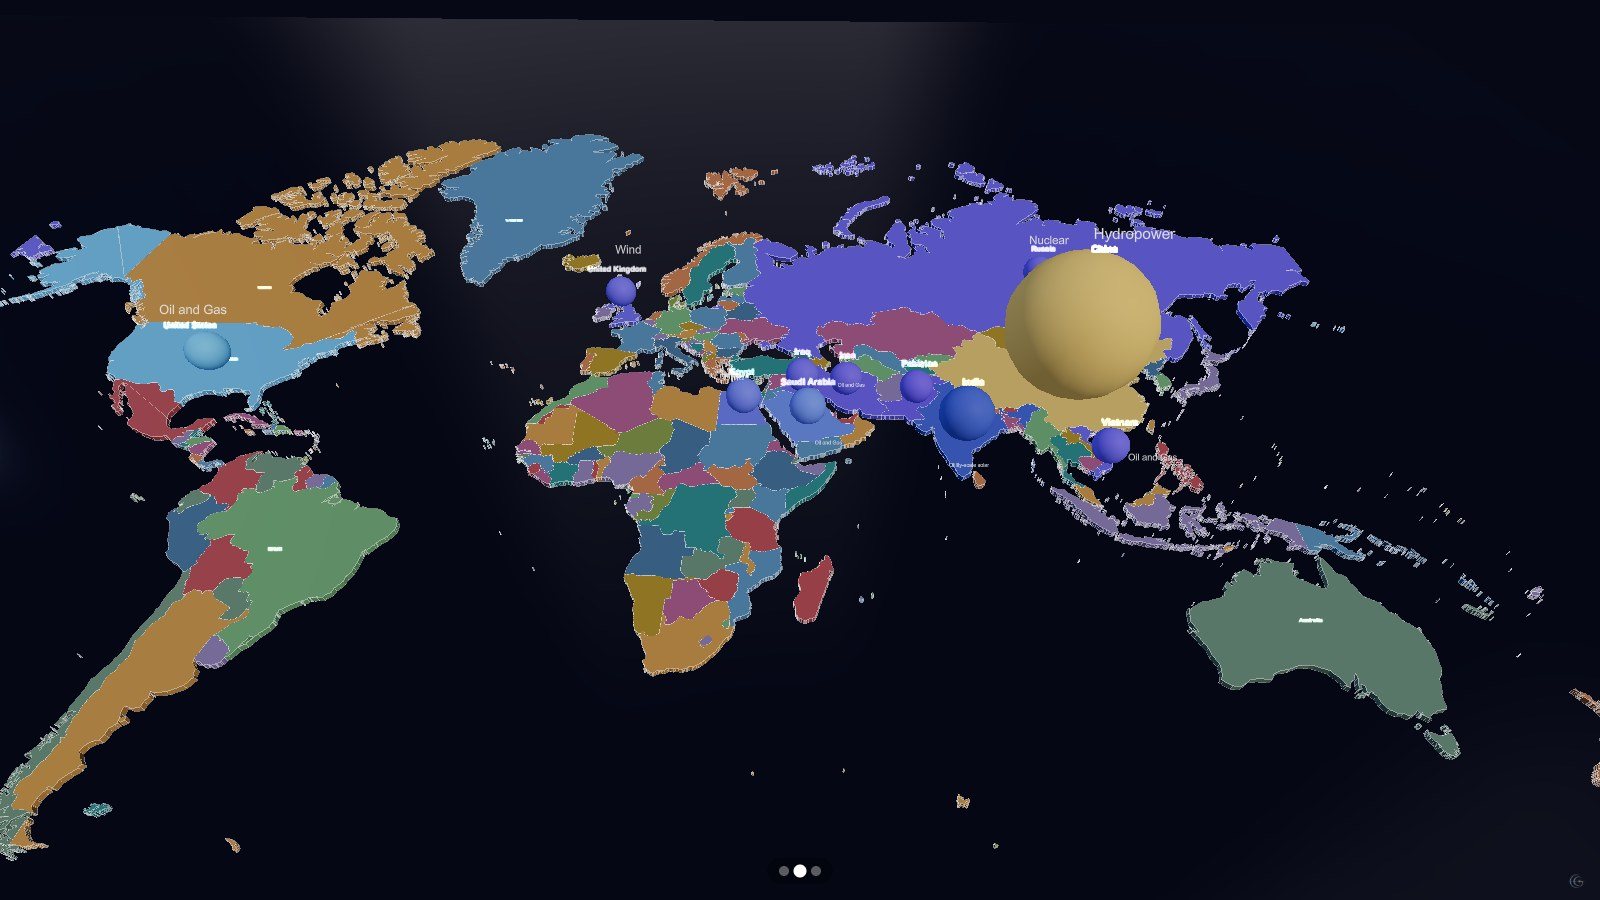
Roughly 1.64 TW of generating capacity is under construction worldwide right now. This three-scene piece asks where that construction is happening, what kind of power it is, and how lopsided the answer turns out to be.
The first scene is the world map: one bubble per country, sized by capacity under construction, with the leading technology named next to each. China dominates so completely that the rest of the map has to be read as a footnote to it — which is the finding, not a framing failure.
The second scene switches from absolute capacity to composition: for each of the eleven largest builders, what share of what they are building is non-fossil. Countries that look similar on the first map separate sharply here, which is the point of showing both.
The third collapses geography entirely into a treemap by technology: utility-scale solar, hydropower, wind, coal, oil and gas, nuclear, bioenergy, geothermal. Three scenes, three questions, one dataset — the pattern most of these stories follow.
What this one demonstrates
- Bubble map sized by capacity
- Absolute values then normalised shares
- Treemap as a closing summary
- Timeline pacing across three scenes
- Chart types
- 3D map, Bubble map, 3D bar chart, Treemap
- Format
- Timeline · 3 scenes
- Topic
- Energy